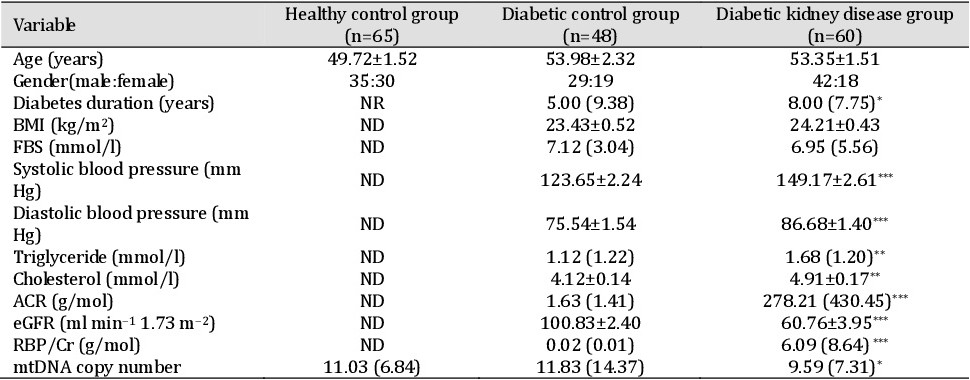
Table 1. Baseline characteristics of healthy control (HC), and diabetic control (DC) and diabetic kidney disease (DKD) group. Data are presented as means ± SEM and as median (interquartile ranges) for non-normally distributed data. * P < 0.05 compared with DC. ** P < 0.01 compared with DC. *** P < 0.001 compared with DC. BMI, body mass index (kg/m2); FBS, fasting blood sugar (mmol/l); ACR, albumin/ creatinine ratio (g/mol); RBP, retinol-binding protein; Cr, creatinine; NR, not recorded; ND, not done